Gantt charts: task bars, groups, milestones, links between tasks, and a line for today.
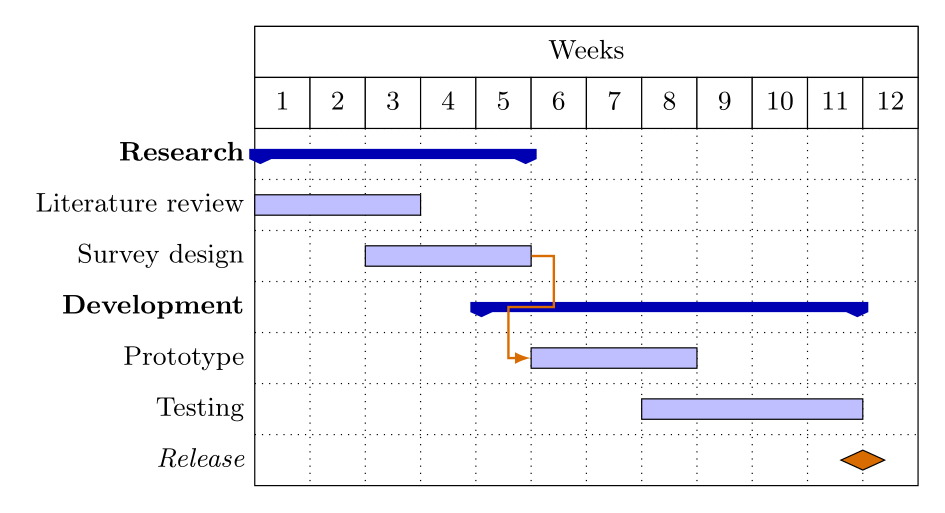
Two phases of a project over twelve weeks, with a dependency and a release milestone.
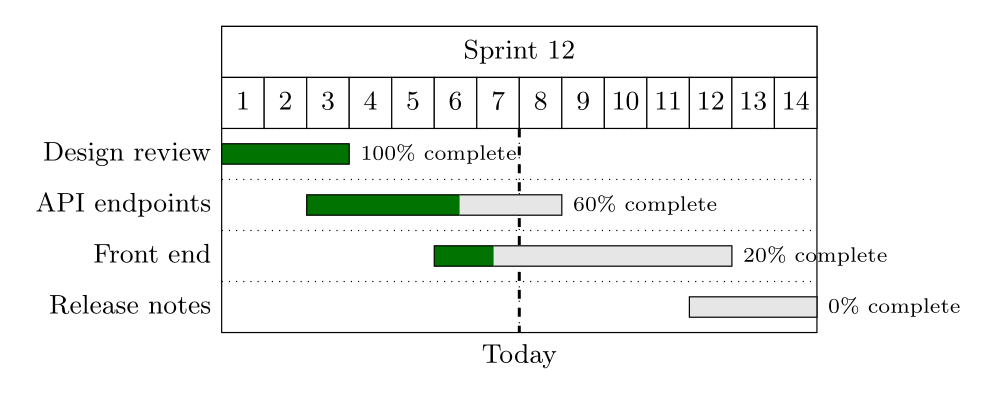
Two weeks of tasks, each bar filled to show how much is done, and a line for today.